
Preseason Bracketology: Our First 2023 NCAA Tournament Bracket Prediction
Here are our predictions for which teams will make the 2023 NCAA tournament as we get ready for the start of the 2022-23 college basketball season.
November 4, 2022 – by Jason Lisk
We are just a few days away from the start of the college basketball season, which tips off on Tuesday, November 8th.
A few days ago, we released our preseason rankings and ratings, along with our preseason predictions for each conference. Here, we’ll provide our bracketology predictions for how the 2023 NCAA tournament will shape up, right before the season begins.
How Did We Do With Last Year’s Preseason Bracketology?
Let’s first recap how last year’s preseason bracketology predictions did compared to the actual 2022 NCAA tournament field.
Two of four top seeds likely correct. Our projected No. 1 seeds last year were Gonzaga, Kansas, Purdue, and Michigan. Gonzaga was the top overall seed, and Kansas won the national title as a No. 1 seed. Meanwhile, Purdue was a No. 3 seed, while Michigan struggled to make the tournament and was one of the last teams in as a No. 11 seed, before reaching the Sweet 16.Twenty-one of 22 conferences correctly projected as one-bid. The conference we missed on the most was the Mountain West, which we projected for only one bid, but which ended up grabbing four (and then went 0-4 in the tournament). We had 10 conferences projected to receive multiple bids, and all of them did.One projected top-four seed missed the tournament. Oregon was the only team projected to be on a top-four seed line that wound up missing the NCAA tournament. Based on our preseason estimates, we would have expected 1.5 teams projected in the top four seeds to miss the tournament, so getting one wrong was right about in line with expectations.Eleven of 22 one-bid conference champs correct. Based on our preseason conference tournament win odds, we expected to get an average of 8.5 correct from those 22 conferences. Getting half of the auto-bids right from the mid-majors and smaller conferences is tough to do, and not a level we expect to hit every year.Thirty-two of 46 at-large quality teams correct. We projected 46 teams above the at-large cutoff line (36 at larges, and 10 projected conference champs). Thirty-two of them made into the 2022 NCAA tournament field. Based on our own odds estimates, we would have expected 34.6 to make it. The underperformance was entirely in teams we projected for the No. 6 to No. 11 seed lines. Meanwhile, several teams we had just out of the field made it, including two of the first four listed out, and 11 different teams with estimated odds of 20% or higher entering the season.Wisconsin, Providence, and Iowa State were our biggest misses: Neither Wisconsin nor Providence was in our projected field, and were the only two teams to get seeded as a top five seed that we did not have projected in our preseason field. Those two also happened to go a combined 27-6 in games decided by 6 points or less, or in overtime. Iowa State, meanwhile, was the biggest long shot to make it, as we gave them only a 1% chance of getting an at-large when the season began. The Cyclones had gone 2-22 the year before, so their turnaround was truly remarkable.The Pac-12 was the biggest disappointment. The biggest conference disappointment was the Pac-12. In addition to the aforementioned Oregon missing the tournament after coming in with high expectations, Arizona State was also a big disappointment, and no other surprise teams emerged to join UCLA, Arizona, and USC in the field.
We weren’t perfect, but we didn’t expect to be. Again, we made these NCAA tournament predictions before the first game of the 2021-22 season.
In the end, we were slightly up on auto bids projected, just about in line with our expectations for the top five seeds, and slightly lower on the second half of the at-large field. Overall, you would have expected 43.1 teams from our projected 68-team field to make it, based on our listed odds. The actual number was 43. Not too bad.
Overall, we think we did pretty well for November!
Now, on to our 2023 NCAA tournament projected bracket.
Preseason Projected No. 1 NCAA Seeds in 2022-23
Here are our projected No. 1 seeds in the 2021 NCAA tournament:
Gonzaga (72% chance)Kentucky (27% chance)North Carolina (24% chance)Tennessee (24% chance)
Now, on to the rest of the bracket…
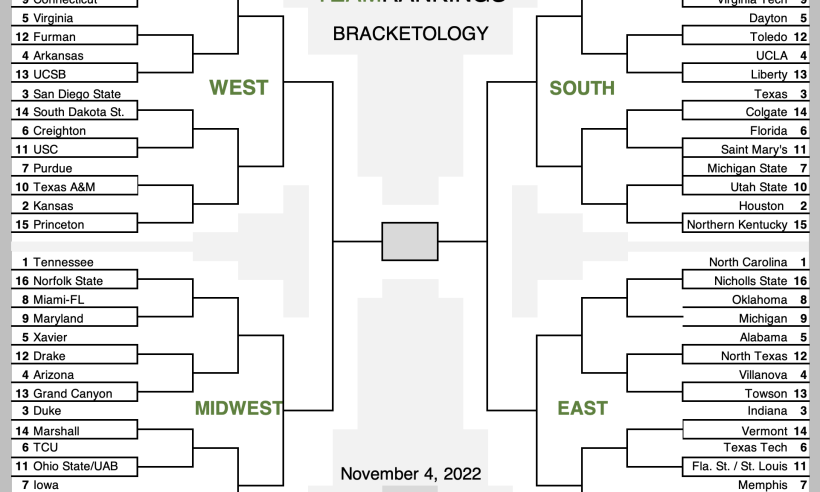
2022-23 Projected NCAA Tournament Bracket (Preseason Edition)
Here is a bracket putting each of the teams into a specific matchup. If you just want to see the projected seeds, you can go down to the table at the bottom of this post.

For details on how this bracket was created, see our original Madness Strikes November blog post. That post goes into more detail, but the basic idea is:
Simulate the regular seasonSeed and play out the conference tournamentsSimulate the NCAA tournament selection and seeding process
2022-23 NCAA Bid Odds for All 363 Teams
Our NCAA selection and seeding model doesn’t directly produce the projected bracket you see above. Its output is a set of odds describing each team’s chance to make the NCAA tournament and to earn each specific seed (among other info).
The bracket is created at the end based on those odds. However, we also use a bit of manual intervention to assign teams to specific bracket lines.
What does that mean for you? It means you get to see lots of juicy data, if you so desire.
Below, you’ll find our official 2023 NCAA Tournament preseason projected bracketology odds for every team. Other pages on our site will be updating various odds on a daily basis as each day’s game results come in:
For a sortable table of similar odds that we update daily, check out our NCAA Bracketology detail page.To go a step further and see projected round-by-round NCAA tournament advancement odds based on our simulated brackets, check out our NCAA Tournament Bracket Predictions.
Some Final Tips for Understanding Our Bracketology Odds
Creating a single projected bracket where every team is either in or out is a bit different than creating projected bid odds, which allow for more nuance.
For example, in one-bid conferences we the team we project as most likely to win the conference tournament in our bracket. However, in many cases that team is still far more likely to miss the tournament than to make it. And a handful of teams in the conference may have a reasonable, but well below 50%, chance to reach the tournament.
A more interesting case is what happens around the at-large bubble. This preseason, the at-large cutline is around 47%. Team that are projected with higher than a 47% chance to make the tournament are in our single bracket, while teams with lower odds are not (unless they are a projected conference champion).
This can create clusters of teams in certain conferences, or in certain groups of conferences, that are just above or just below the cutline. As a result, just counting up the number of teams in the bracket for those conferences or groups may make their outlook look better or worse than it really is.
For comparison, here is the number of teams appearing in the at-large bid range in our bracket projections (36 at-larges plus 11 auto bids) versus the number of teams we expect from each conference when we add up each individual team’s chances of making the tournament:
| Conference | Preseason Field | Expected |
|---|---|---|
| SEC | 8 | 7.8 |
| Big Ten | 7 | 6.6 |
| Big 12 | 7 | 6.3 |
| ACC | 6 | 5.8 |
| Big East | 5 | 4.8 |
| Pac 12 | 4 | 4.5 |
| Mountain West | 2 | 2.5 |
| American | 2 | 2.5 |
| Atlantic 10 | 2 | 2.4 |
| West Coast | 2 | 2.1 |
| Conference USA | 2 | 1.6 |
| TOTAL | 47 | 46.9 |
Take a look at the Mountain West and Conference USA. The Mountain West has an expected average of of 2.5 NCAA tourney teams, versus 1.6 for Conference USA. We think the Mountain West is likely to get two or three teams, and Conference USA is more likely to get only one or two. But they both have exactly two teams in our projected bracket.
We project that the third best team in Conference USA is unlikely to make the NCAA Tournament, but the second best team has a reasonable shot. And there’s a clear top two teams in CUSA this season, Northern Kentucky and UAB, so we’re including both in the projected bracket.
On the other hand our model thinks the Mountain West is strong enough that not only the second but also the third best team will have a reasonable shot at the tourney. We just don’t have a great idea who that third best team will be at this point, so no individual team’s projected bid percentage is high enough to be included in our bracket.
Similarly, we expect that the next tier of conferences outside the traditional Power 6 (the American, Atlantic-10, Mountain West, and West Coast) to collectively have 9.5 teams in the tournament. But we have only eight projected in the field. So we anticipate that some more teams from those conferences will put together the resumés needed to get in, but identifying the specific ones is a bit harder.
Without Further Ado…
Here are our 2022-23 preseason bracketology odds for every team:
| TR Bracket Seed | Team | Bid | Auto | At Large | Avg Seed If In | 1-4 Seed | 1 Seed |
|---|---|---|---|---|---|---|---|
| 1 | Gonzaga | 98% | 72% | 26% | 1.6 | 94% | 72% |
| 1 | Kentucky | 94% | 22% | 71% | 3.6 | 65% | 27% |
| 1 | N Carolina | 96% | 29% | 66% | 3.8 | 65% | 24% |
| 1 | Tennessee | 92% | 20% | 72% | 3.8 | 62% | 24% |
| 2 | Baylor | 93% | 23% | 70% | 4.1 | 58% | 21% |
| 2 | Houston | 86% | 41% | 45% | 4.5 | 50% | 12% |
| 2 | Auburn | 91% | 12% | 79% | 5.2 | 45% | 14% |
| 2 | Kansas | 88% | 15% | 73% | 5.4 | 41% | 12% |
| 3 | San Diego St | 78% | 36% | 42% | 4.8 | 42% | 9% |
| 3 | Texas | 83% | 16% | 67% | 5.1 | 41% | 11% |
| 3 | Duke | 83% | 18% | 66% | 5.0 | 41% | 9% |
| 3 | Indiana | 87% | 19% | 68% | 5.3 | 41% | 10% |
| 4 | Arizona | 81% | 25% | 56% | 5.0 | 40% | 9% |
| 4 | Villanova | 85% | 22% | 63% | 5.3 | 40% | 9% |
| 4 | Arkansas | 85% | 10% | 75% | 5.5 | 38% | 10% |
| 4 | UCLA | 82% | 23% | 59% | 5.4 | 37% | 7% |
| 5 | Virginia | 81% | 15% | 66% | 5.5 | 35% | 7% |
| 5 | Alabama | 90% | 9% | 80% | 6.1 | 36% | 9% |
| 5 | Dayton | 77% | 39% | 38% | 5.4 | 34% | 5% |
| 5 | Xavier | 80% | 20% | 60% | 5.5 | 35% | 8% |
| 6 | Texas Tech | 73% | 12% | 61% | 5.5 | 31% | 7% |
| 6 | Creighton | 75% | 18% | 58% | 6.0 | 29% | 5% |
| 6 | Florida | 76% | 8% | 68% | 6.1 | 28% | 6% |
| 6 | TX Christian | 56% | 12% | 43% | 4.9 | 27% | 5% |
| 7 | Michigan St | 83% | 12% | 71% | 6.8 | 26% | 5% |
| 7 | Iowa | 64% | 12% | 52% | 6.0 | 23% | 4% |
| 7 | Purdue | 67% | 11% | 56% | 6.2 | 23% | 4% |
| 7 | Memphis | 73% | 22% | 51% | 6.8 | 21% | 3% |
| 8 | Oklahoma St | 73% | 7% | 66% | 7.2 | 19% | 3% |
| 8 | Oregon | 60% | 13% | 47% | 6.3 | 19% | 3% |
| 8 | Miami (FL) | 55% | 9% | 46% | 6.1 | 18% | 2% |
| 8 | Oklahoma | 65% | 7% | 58% | 6.9 | 18% | 4% |
| 9 | Michigan | 64% | 8% | 55% | 7.1 | 16% | 2% |
| 9 | VA Tech | 53% | 9% | 44% | 6.0 | 19% | 3% |
| 9 | Connecticut | 55% | 12% | 43% | 6.4 | 17% | 2% |
| 9 | Maryland | 60% | 8% | 52% | 7.0 | 16% | 2% |
| 10 | Texas A&M | 57% | 4% | 53% | 7.2 | 14% | 2% |
| 10 | Utah State | 52% | 19% | 33% | 6.6 | 16% | 2% |
| 10 | Mississippi | 55% | 4% | 51% | 7.2 | 13% | 2% |
| 10 | Seton Hall | 56% | 9% | 47% | 7.6 | 12% | 1% |
| 11 | St Marys | 59% | 9% | 50% | 8.0 | 10% | 1% |
| 11 | Saint Louis | 55% | 18% | 37% | 7.7 | 11% | 1% |
| 11 | USC | 50% | 10% | 41% | 7.1 | 12% | 1% |
| 11 | Florida St | 49% | 6% | 43% | 7.3 | 11% | 1% |
| 11 | Ohio State | 49% | 6% | 43% | 7.7 | 9% | 1% |
| 11 | UAB | 48% | 27% | 21% | 8.7 | 5% | 0% |
| 12 | North Texas | 46% | 32% | 14% | 8.0 | 8% | 0% |
| 12 | Drake | 24% | 22% | 2% | 10.4 | 1% | 0% |
| 12 | Furman | 40% | 37% | 4% | 11.0 | 1% | 0% |
| 12 | Toledo | 40% | 40% | 0% | 11.0 | 1% | 0% |
| 13 | Grd Canyon | 27% | 27% | 0% | 11.6 | 0% | 0% |
| 13 | Towson | 30% | 30% | 0% | 12.1 | 0% | 0% |
| 13 | UCSB | 30% | 30% | 0% | 12.8 | 0% | 0% |
| 13 | Liberty | 39% | 39% | 0% | 12.9 | 0% | 0% |
| 14 | S Dakota St | 41% | 41% | 0% | 13.0 | 0% | 0% |
| 14 | Vermont | 52% | 52% | 0% | 13.0 | 0% | 0% |
| 14 | Marshall | 13% | 13% | 0% | 13.1 | 0% | 0% |
| 14 | Colgate | 54% | 54% | 0% | 13.5 | 0% | 0% |
| 15 | Princeton | 28% | 28% | 0% | 13.8 | 0% | 0% |
| 15 | Iona | 26% | 26% | 0% | 13.7 | 0% | 0% |
| 15 | Montana St | 20% | 20% | 0% | 14.4 | 0% | 0% |
| 15 | N Kentucky | 19% | 19% | 0% | 14.4 | 0% | 0% |
| 16 | Southern | 22% | 22% | 0% | 15.3 | 0% | 0% |
| 16 | Norfolk St | 47% | 47% | 0% | 14.8 | 0% | 0% |
| 16 | Nicholls St | 37% | 37% | 0% | 15.1 | 0% | 0% |
| 16 | Longwood | 21% | 21% | 0% | 14.4 | 0% | 0% |
| 16 | Morehead St | 34% | 34% | 0% | 15.0 | 0% | 0% |
| 16 | Wagner | 39% | 39% | 0% | 15.5 | 0% | 0% |
| LSU | 45% | 4% | 40% | 6.4 | 13% | 2% | |
| Illinois | 45% | 8% | 37% | 6.5 | 13% | 1% | |
| Stanford | 45% | 10% | 35% | 7.0 | 11% | 1% | |
| Wisconsin | 42% | 4% | 38% | 8.2 | 6% | 1% | |
| Iowa State | 40% | 5% | 36% | 7.2 | 9% | 1% | |
| Rutgers | 40% | 6% | 34% | 7.0 | 9% | 1% | |
| W Virginia | 39% | 2% | 37% | 9.2 | 4% | 0% | |
| Cincinnati | 37% | 17% | 20% | 6.3 | 12% | 1% | |
| Wash State | 36% | 4% | 32% | 9.3 | 3% | 0% | |
| Arizona St | 36% | 5% | 31% | 8.5 | 4% | 0% | |
| Colorado | 35% | 7% | 29% | 7.6 | 6% | 1% | |
| Notre Dame | 35% | 4% | 31% | 7.2 | 8% | 1% | |
| Wyoming | 35% | 10% | 25% | 8.1 | 5% | 0% | |
| Vanderbilt | 33% | 1% | 31% | 8.7 | 4% | 0% | |
| Boise State | 33% | 9% | 23% | 8.3 | 4% | 0% | |
| St Johns | 32% | 7% | 25% | 7.2 | 7% | 1% | |
| BYU | 32% | 12% | 20% | 6.1 | 11% | 1% | |
| DePaul | 32% | 3% | 28% | 9.2 | 3% | 0% | |
| Penn State | 31% | 3% | 28% | 8.0 | 4% | 0% | |
| Oral Roberts | 28% | 28% | 0% | 13.7 | 0% | 0% | |
| Marquette | 27% | 4% | 23% | 8.6 | 3% | 0% | |
| Miss State | 26% | 2% | 24% | 7.4 | 5% | 1% | |
| Syracuse | 26% | 2% | 24% | 8.3 | 3% | 0% | |
| TX A&M-CC | 24% | 24% | 0% | 15.4 | 0% | 0% | |
| Clemson | 24% | 2% | 22% | 8.8 | 2% | 0% | |
| Loyola-Chi | 24% | 11% | 13% | 8.6 | 2% | 0% | |
| Missouri | 24% | 2% | 22% | 7.1 | 5% | 0% | |
| Yale | 22% | 22% | 0% | 13.3 | 0% | 0% | |
| NC State | 22% | 2% | 20% | 8.8 | 2% | 0% | |
| UC Irvine | 21% | 21% | 0% | 13.0 | 0% | 0% | |
| Akron | 21% | 21% | 0% | 12.6 | 0% | 0% | |
| Wake Forest | 20% | 1% | 19% | 9.5 | 1% | 0% | |
| U Penn | 20% | 20% | 0% | 13.3 | 0% | 0% | |
| Kansas St | 20% | 1% | 19% | 9.0 | 2% | 0% | |
| TX Southern | 20% | 20% | 0% | 15.4 | 0% | 0% | |
| NC-Asheville | 20% | 20% | 0% | 14.5 | 0% | 0% | |
| Richmond | 20% | 8% | 11% | 9.0 | 2% | 0% | |
| E Washingtn | 20% | 20% | 0% | 14.4 | 0% | 0% | |
| Bradley | 19% | 17% | 2% | 11.1 | 0% | 0% | |
| NC-Grnsboro | 19% | 17% | 2% | 12.3 | 0% | 0% | |
| IPFW | 18% | 18% | 0% | 14.5 | 0% | 0% | |
| Chattanooga | 18% | 18% | 0% | 12.4 | 0% | 0% | |
| Winthrop | 18% | 18% | 0% | 14.5 | 0% | 0% | |
| Hofstra | 18% | 18% | 0% | 13.0 | 0% | 0% | |
| Bryant | 17% | 17% | 0% | 14.4 | 0% | 0% | |
| VCU | 17% | 6% | 11% | 9.5 | 1% | 0% | |
| Fresno St | 17% | 7% | 9% | 8.3 | 2% | 0% | |
| Wright State | 17% | 17% | 0% | 14.6 | 0% | 0% | |
| TN Martin | 16% | 16% | 0% | 15.5 | 0% | 0% | |
| Providence | 16% | 3% | 13% | 8.7 | 1% | 0% | |
| LIU | 16% | 16% | 0% | 15.8 | 0% | 0% | |
| San Francisco | 16% | 4% | 11% | 7.9 | 2% | 0% | |
| Belmont | 16% | 14% | 2% | 11.2 | 0% | 0% | |
| TN State | 16% | 16% | 0% | 15.4 | 0% | 0% | |
| Kent State | 16% | 16% | 0% | 12.9 | 0% | 0% | |
| W Kentucky | 16% | 11% | 5% | 10.6 | 0% | 0% | |
| Howard | 16% | 16% | 0% | 15.6 | 0% | 0% | |
| South Dakota | 16% | 16% | 0% | 14.3 | 0% | 0% | |
| Fla Atlantic | 16% | 10% | 6% | 10.6 | 0% | 0% | |
| Butler | 15% | 2% | 14% | 9.5 | 1% | 0% | |
| Temple | 15% | 4% | 11% | 9.8 | 1% | 0% | |
| Davidson | 15% | 5% | 10% | 9.7 | 1% | 0% | |
| Northwestern | 15% | 1% | 14% | 9.1 | 1% | 0% | |
| Montana | 15% | 15% | 0% | 14.6 | 0% | 0% | |
| Hawaii | 15% | 15% | 0% | 13.7 | 0% | 0% | |
| Weber State | 15% | 15% | 0% | 14.6 | 0% | 0% | |
| Oakland | 14% | 14% | 0% | 14.7 | 0% | 0% | |
| St Fran (PA) | 14% | 14% | 0% | 15.9 | 0% | 0% | |
| Jacksonville | 14% | 14% | 0% | 13.7 | 0% | 0% | |
| Alabama St | 14% | 14% | 0% | 15.5 | 0% | 0% | |
| Youngs St | 14% | 14% | 0% | 14.7 | 0% | 0% | |
| Louisville | 14% | 1% | 13% | 10.3 | 0% | 0% | |
| Sacred Hrt | 14% | 14% | 0% | 15.9 | 0% | 0% | |
| Gard-Webb | 13% | 13% | 0% | 14.8 | 0% | 0% | |
| St Peters | 13% | 13% | 0% | 14.6 | 0% | 0% | |
| Utah Val St | 13% | 13% | 0% | 12.7 | 0% | 0% | |
| Mass Lowell | 13% | 13% | 0% | 14.7 | 0% | 0% | |
| James Mad | 12% | 12% | 0% | 13.0 | 0% | 0% | |
| LA Tech | 12% | 9% | 3% | 10.9 | 0% | 0% | |
| Col Charlestn | 12% | 12% | 0% | 13.4 | 0% | 0% | |
| S Alabama | 12% | 12% | 0% | 13.3 | 0% | 0% | |
| Colorado St | 12% | 5% | 7% | 9.1 | 1% | 0% | |
| N Colorado | 12% | 12% | 0% | 14.8 | 0% | 0% | |
| Abl Christian | 12% | 12% | 0% | 12.9 | 0% | 0% | |
| S Illinois | 12% | 11% | 0% | 12.0 | 0% | 0% | |
| Utah | 11% | 2% | 9% | 8.8 | 1% | 0% | |
| UNLV | 11% | 6% | 5% | 10.4 | 0% | 0% | |
| New Orleans | 11% | 11% | 0% | 15.8 | 0% | 0% | |
| Tulane | 11% | 6% | 5% | 8.4 | 1% | 0% | |
| Rider | 11% | 11% | 0% | 14.8 | 0% | 0% | |
| Boston U | 10% | 10% | 0% | 15.0 | 0% | 0% | |
| Delaware | 10% | 10% | 0% | 13.6 | 0% | 0% | |
| Texas State | 10% | 10% | 0% | 13.5 | 0% | 0% | |
| Seattle | 10% | 10% | 0% | 12.9 | 0% | 0% | |
| Prairie View | 10% | 10% | 0% | 15.7 | 0% | 0% | |
| Nebraska | 10% | 1% | 9% | 10.1 | 0% | 0% | |
| Middle Tenn | 10% | 5% | 5% | 11.6 | 0% | 0% | |
| Geo Mason | 10% | 3% | 7% | 10.5 | 0% | 0% | |
| Navy | 10% | 10% | 0% | 14.9 | 0% | 0% | |
| Washington | 10% | 1% | 8% | 9.9 | 0% | 0% | |
| Fla Gulf Cst | 10% | 10% | 0% | 14.0 | 0% | 0% | |
| Campbell | 10% | 10% | 0% | 15.0 | 0% | 0% | |
| NC-Wilmgton | 10% | 10% | 0% | 13.9 | 0% | 0% | |
| LA Lafayette | 9% | 9% | 0% | 13.5 | 0% | 0% | |
| SIU Edward | 9% | 9% | 0% | 15.7 | 0% | 0% | |
| UC Riverside | 9% | 9% | 0% | 14.1 | 0% | 0% | |
| Fairfield | 9% | 9% | 0% | 14.8 | 0% | 0% | |
| St Fran (NY) | 9% | 9% | 0% | 15.9 | 0% | 0% | |
| Jksnville St | 9% | 9% | 0% | 14.0 | 0% | 0% | |
| Coppin State | 9% | 9% | 0% | 15.8 | 0% | 0% | |
| Harvard | 9% | 9% | 0% | 14.1 | 0% | 0% | |
| Missouri St | 9% | 8% | 1% | 12.1 | 0% | 0% | |
| AR Lit Rock | 9% | 9% | 0% | 15.7 | 0% | 0% | |
| Maryland ES | 9% | 9% | 0% | 15.9 | 0% | 0% | |
| Morgan St | 9% | 9% | 0% | 15.9 | 0% | 0% | |
| NC Central | 9% | 9% | 0% | 15.8 | 0% | 0% | |
| Samford | 8% | 8% | 0% | 13.5 | 0% | 0% | |
| GA Tech | 8% | 1% | 7% | 7.6 | 1% | 0% | |
| N Florida | 8% | 8% | 0% | 14.2 | 0% | 0% | |
| Quinnipiac | 8% | 8% | 0% | 15.0 | 0% | 0% | |
| TN Tech | 8% | 8% | 0% | 15.7 | 0% | 0% | |
| Brown | 8% | 8% | 0% | 14.2 | 0% | 0% | |
| Wofford | 8% | 8% | 0% | 13.5 | 0% | 0% | |
| N Iowa | 8% | 7% | 1% | 12.2 | 0% | 0% | |
| Coastal Car | 8% | 8% | 0% | 13.5 | 0% | 0% | |
| Boston Col | 8% | 1% | 7% | 9.8 | 0% | 0% | |
| Cal Baptist | 8% | 8% | 0% | 13.1 | 0% | 0% | |
| Ste F Austin | 8% | 8% | 0% | 13.3 | 0% | 0% | |
| Lg Beach St | 8% | 8% | 0% | 14.2 | 0% | 0% | |
| Cornell | 8% | 8% | 0% | 14.3 | 0% | 0% | |
| N Mex State | 8% | 8% | 0% | 13.0 | 0% | 0% | |
| Sam Hous St | 8% | 8% | 0% | 13.4 | 0% | 0% | |
| Murray St | 7% | 6% | 1% | 12.4 | 0% | 0% | |
| Georgia St | 7% | 7% | 0% | 13.6 | 0% | 0% | |
| Sac State | 7% | 7% | 0% | 15.1 | 0% | 0% | |
| Beth-Cook | 7% | 7% | 0% | 15.8 | 0% | 0% | |
| Niagara | 7% | 7% | 0% | 15.1 | 0% | 0% | |
| Alcorn State | 7% | 7% | 0% | 15.8 | 0% | 0% | |
| N Dakota St | 7% | 7% | 0% | 15.0 | 0% | 0% | |
| Portland St | 7% | 7% | 0% | 15.2 | 0% | 0% | |
| App State | 7% | 7% | 0% | 13.7 | 0% | 0% | |
| Wichita St | 7% | 3% | 4% | 9.4 | 1% | 0% | |
| SE Louisiana | 7% | 7% | 0% | 15.9 | 0% | 0% | |
| Grambling St | 7% | 7% | 0% | 15.8 | 0% | 0% | |
| S Methodist | 7% | 2% | 5% | 10.2 | 0% | 0% | |
| Mt St Marys | 7% | 7% | 0% | 15.1 | 0% | 0% | |
| Central FL | 7% | 2% | 4% | 10.0 | 0% | 0% | |
| Loyola-MD | 7% | 7% | 0% | 15.2 | 0% | 0% | |
| Nevada | 7% | 3% | 4% | 10.2 | 0% | 0% | |
| Ohio | 7% | 7% | 0% | 14.0 | 0% | 0% | |
| NW State | 6% | 6% | 0% | 15.8 | 0% | 0% | |
| Northeastrn | 6% | 6% | 0% | 14.1 | 0% | 0% | |
| Siena | 6% | 6% | 0% | 15.1 | 0% | 0% | |
| Old Dominion | 6% | 6% | 0% | 13.8 | 0% | 0% | |
| Indiana St | 6% | 6% | 0% | 12.8 | 0% | 0% | |
| Army | 6% | 6% | 0% | 15.3 | 0% | 0% | |
| S Utah | 6% | 6% | 0% | 13.4 | 0% | 0% | |
| Buffalo | 6% | 6% | 0% | 14.0 | 0% | 0% | |
| CS Fullerton | 6% | 6% | 0% | 14.4 | 0% | 0% | |
| Detroit | 6% | 6% | 0% | 15.3 | 0% | 0% | |
| S Carolina | 6% | 0% | 6% | 9.7 | 0% | 0% | |
| New Mexico | 6% | 3% | 3% | 9.7 | 0% | 0% | |
| SE Missouri | 6% | 6% | 0% | 15.8 | 0% | 0% | |
| Illinois St | 6% | 6% | 0% | 12.9 | 0% | 0% | |
| Lipscomb | 6% | 6% | 0% | 14.3 | 0% | 0% | |
| Maryland BC | 6% | 6% | 0% | 15.1 | 0% | 0% | |
| GA Southern | 6% | 6% | 0% | 13.8 | 0% | 0% | |
| McNeese St | 6% | 6% | 0% | 15.9 | 0% | 0% | |
| UC Davis | 6% | 6% | 0% | 14.4 | 0% | 0% | |
| Minnesota | 6% | 1% | 5% | 9.2 | 0% | 0% | |
| Georgia | 6% | 0% | 5% | 9.4 | 0% | 0% | |
| Mercer | 6% | 5% | 0% | 13.8 | 0% | 0% | |
| St Bonavent | 5% | 2% | 3% | 10.5 | 0% | 0% | |
| Santa Clara | 5% | 1% | 4% | 9.5 | 0% | 0% | |
| Charlotte | 5% | 3% | 2% | 12.2 | 0% | 0% | |
| Georgetown | 5% | 1% | 4% | 10.1 | 0% | 0% | |
| Radford | 5% | 5% | 0% | 15.3 | 0% | 0% | |
| High Point | 5% | 5% | 0% | 15.4 | 0% | 0% | |
| Dartmouth | 5% | 5% | 0% | 14.6 | 0% | 0% | |
| U Mass | 5% | 2% | 3% | 10.8 | 0% | 0% | |
| Canisius | 5% | 5% | 0% | 15.2 | 0% | 0% | |
| Cleveland St | 5% | 5% | 0% | 15.4 | 0% | 0% | |
| Austin Peay | 5% | 5% | 0% | 14.4 | 0% | 0% | |
| Drexel | 4% | 4% | 0% | 14.6 | 0% | 0% | |
| Central Conn | 4% | 4% | 0% | 16.0 | 0% | 0% | |
| Hsn Christian | 4% | 4% | 0% | 15.9 | 0% | 0% | |
| Kennesaw St | 4% | 4% | 0% | 14.6 | 0% | 0% | |
| Presbyterian | 4% | 4% | 0% | 15.4 | 0% | 0% | |
| Alab A&M | 4% | 4% | 0% | 15.8 | 0% | 0% | |
| Albany | 4% | 4% | 0% | 15.2 | 0% | 0% | |
| F Dickinson | 4% | 4% | 0% | 16.0 | 0% | 0% | |
| Jackson St | 4% | 4% | 0% | 15.9 | 0% | 0% | |
| Pittsburgh | 4% | 0% | 3% | 10.4 | 0% | 0% | |
| Ball State | 4% | 4% | 0% | 14.4 | 0% | 0% | |
| La Salle | 4% | 2% | 2% | 11.1 | 0% | 0% | |
| Binghamton | 4% | 4% | 0% | 15.3 | 0% | 0% | |
| E Tenn St | 4% | 4% | 0% | 14.2 | 0% | 0% | |
| N Arizona | 3% | 3% | 0% | 15.5 | 0% | 0% | |
| Manhattan | 3% | 3% | 0% | 15.5 | 0% | 0% | |
| WI-Milwkee | 3% | 3% | 0% | 15.4 | 0% | 0% | |
| Troy | 3% | 3% | 0% | 14.3 | 0% | 0% | |
| Lehigh | 3% | 3% | 0% | 15.6 | 0% | 0% | |
| Stony Brook | 3% | 3% | 0% | 14.7 | 0% | 0% | |
| Marist | 3% | 3% | 0% | 15.4 | 0% | 0% | |
| Denver | 3% | 3% | 0% | 15.5 | 0% | 0% | |
| E Kentucky | 3% | 3% | 0% | 14.5 | 0% | 0% | |
| Bucknell | 3% | 3% | 0% | 15.5 | 0% | 0% | |
| American | 3% | 3% | 0% | 15.5 | 0% | 0% | |
| Rob Morris | 3% | 3% | 0% | 15.5 | 0% | 0% | |
| Valparaiso | 3% | 3% | 0% | 13.5 | 0% | 0% | |
| Rhode Island | 3% | 1% | 1% | 11.0 | 0% | 0% | |
| SC Upstate | 3% | 3% | 0% | 15.7 | 0% | 0% | |
| Cal Poly | 2% | 2% | 0% | 15.1 | 0% | 0% | |
| Lafayette | 2% | 2% | 0% | 15.6 | 0% | 0% | |
| UMKC | 2% | 2% | 0% | 15.6 | 0% | 0% | |
| Lamar | 2% | 2% | 0% | 16.0 | 0% | 0% | |
| Monmouth | 2% | 2% | 0% | 14.7 | 0% | 0% | |
| Arkansas St | 2% | 2% | 0% | 14.6 | 0% | 0% | |
| N Hampshire | 2% | 2% | 0% | 15.5 | 0% | 0% | |
| LA Monroe | 2% | 2% | 0% | 14.5 | 0% | 0% | |
| CS Bakersfld | 2% | 2% | 0% | 15.1 | 0% | 0% | |
| Florida A&M | 2% | 2% | 0% | 16.0 | 0% | 0% | |
| W Illinois | 2% | 2% | 0% | 15.6 | 0% | 0% | |
| TX El Paso | 2% | 1% | 0% | 12.8 | 0% | 0% | |
| Miami (OH) | 2% | 2% | 0% | 14.8 | 0% | 0% | |
| W Michigan | 2% | 2% | 0% | 15.0 | 0% | 0% | |
| Incar Word | 2% | 2% | 0% | 16.0 | 0% | 0% | |
| NC A&T | 2% | 2% | 0% | 14.9 | 0% | 0% | |
| Ark Pine Bl | 2% | 2% | 0% | 16.0 | 0% | 0% | |
| S Car State | 2% | 2% | 0% | 16.0 | 0% | 0% | |
| Bowling Grn | 2% | 2% | 0% | 14.8 | 0% | 0% | |
| NJIT | 2% | 2% | 0% | 15.5 | 0% | 0% | |
| Duquesne | 2% | 1% | 1% | 11.8 | 0% | 0% | |
| Loyola Mymt | 2% | 0% | 1% | 10.7 | 0% | 0% | |
| San Diego | 2% | 1% | 1% | 10.1 | 0% | 0% | |
| Tulsa | 1% | 1% | 1% | 11.4 | 0% | 0% | |
| Idaho State | 1% | 1% | 0% | 15.7 | 0% | 0% | |
| VA Military | 1% | 1% | 0% | 14.9 | 0% | 0% | |
| California | 1% | 0% | 1% | 11.1 | 0% | 0% | |
| Cal St Nrdge | 1% | 1% | 0% | 15.3 | 0% | 0% | |
| S Florida | 1% | 1% | 0% | 11.3 | 0% | 0% | |
| Charl South | 1% | 1% | 0% | 15.7 | 0% | 0% | |
| S Mississippi | 1% | 1% | 0% | 15.0 | 0% | 0% | |
| Rice | 1% | 1% | 0% | 13.8 | 0% | 0% | |
| Florida Intl | 1% | 1% | 0% | 13.5 | 0% | 0% | |
| W Carolina | 1% | 1% | 0% | 14.9 | 0% | 0% | |
| Citadel | 1% | 1% | 0% | 14.9 | 0% | 0% | |
| St Josephs | 1% | 1% | 0% | 12.1 | 0% | 0% | |
| N Illinois | 1% | 1% | 0% | 15.3 | 0% | 0% | |
| TX-Arlington | 1% | 1% | 0% | 14.4 | 0% | 0% | |
| E Illinois | 1% | 1% | 0% | 15.9 | 0% | 0% | |
| WI-Grn Bay | 1% | 1% | 0% | 15.9 | 0% | 0% | |
| Stetson | 1% | 1% | 0% | 15.1 | 0% | 0% | |
| Elon | 1% | 1% | 0% | 15.2 | 0% | 0% | |
| Wm & Mary | 1% | 1% | 0% | 15.3 | 0% | 0% | |
| Delaware St | 1% | 1% | 0% | 16.0 | 0% | 0% | |
| Hampton | 1% | 1% | 0% | 15.3 | 0% | 0% | |
| Holy Cross | 1% | 1% | 0% | 15.7 | 0% | 0% | |
| E Michigan | 1% | 1% | 0% | 15.2 | 0% | 0% | |
| N Alabama | 1% | 1% | 0% | 15.2 | 0% | 0% | |
| Maine | 1% | 1% | 0% | 15.7 | 0% | 0% | |
| Neb Omaha | 1% | 1% | 0% | 15.8 | 0% | 0% | |
| North Dakota | 1% | 1% | 0% | 15.8 | 0% | 0% | |
| Portland | 1% | 0% | 0% | 10.8 | 0% | 0% | |
| Central Mich | 1% | 1% | 0% | 15.4 | 0% | 0% | |
| Fordham | 0% | 0% | 0% | 13.3 | 0% | 0% | |
| Geo Wshgtn | 0% | 0% | 0% | 12.9 | 0% | 0% | |
| Evansville | 0% | 0% | 0% | 14.4 | 0% | 0% | |
| Idaho | 0% | 0% | 0% | 15.9 | 0% | 0% | |
| TX-San Ant | 0% | 0% | 0% | 14.3 | 0% | 0% | |
| TX-Pan Am | 0% | 0% | 0% | 14.8 | 0% | 0% | |
| Central Ark | 0% | 0% | 0% | 15.5 | 0% | 0% | |
| IL-Chicago | 0% | 0% | 0% | 14.8 | 0% | 0% | |
| Columbia | 0% | 0% | 0% | 15.5 | 0% | 0% | |
| Miss Val St | 0% | 0% | 0% | 16.0 | 0% | 0% | |
| Pepperdine | 0% | 0% | 0% | 11.8 | 0% | 0% | |
| San Jose St | 0% | 0% | 0% | 12.7 | 0% | 0% | |
| Air Force | 0% | 0% | 0% | 13.3 | 0% | 0% | |
| E Carolina | 0% | 0% | 0% | 14.0 | 0% | 0% | |
| Oregon St | 0% | 0% | 0% | 11.9 | 0% | 0% | |
| IUPUI | 0% | 0% | 0% | 16.0 | 0% | 0% | |
| Pacific | 0% | 0% | 0% | 14.2 | 0% | 0% | |
| Chicago St | 0% | 0% | 0% | 0.0 | 0% | 0% | |
| Hartford | 0% | 0% | 0% | 0.0 | 0% | 0% | |
| S Indiana | 0% | 0% | 0% | 0.0 | 0% | 0% | |
| St. Thomas | 0% | 0% | 0% | 0.0 | 0% | 0% | |
| Lindenwood | 0% | 0% | 0% | 0.0 | 0% | 0% | |
| Merrimack | 0% | 0% | 0% | 0.0 | 0% | 0% | |
| TX A&M-Com | 0% | 0% | 0% | 0.0 | 0% | 0% | |
| Queens | 0% | 0% | 0% | 0.0 | 0% | 0% | |
| UC San Diego | 0% | 0% | 0% | 0.0 | 0% | 0% | |
| Utah Tech | 0% | 0% | 0% | 0.0 | 0% | 0% | |
| Bellarmine | 0% | 0% | 0% | 0.0 | 0% | 0% | |
| Tarleton State | 0% | 0% | 0% | 0.0 | 0% | 0% | |
| Stonehill | 0% | 0% | 0% | 0.0 | 0% | 0% |
NFL PredictionsNFL TrendsNFL OddsNFL MatchupsNBA PredictionsNBA TrendsNBA OddsNBA MatchupsMLB PredictionsMLB TrendsMLB OddsMLB MatchupsNCAAF PredictionsNCAAF TrendsNCF OddsNCAAF MatchupsNCAAB PredictionsNCAAB TrendsNCB OddsNCAAB Matchups A product ofTeamRankings BlogAboutTeamJobsContact
© 2005-2024 Team Rankings, LLC. All Rights Reserved. Statistical data provided by Gracenote.
TeamRankings.com is not affiliated with the National Collegiate Athletic Association (NCAA®) or March Madness Athletic Association, neither of which has supplied, reviewed, approved or endorsed the material on this site. TeamRankings.com is solely responsible for this site but makes no guarantee about the accuracy or completeness of the information herein.
Terms of ServicePrivacy Policy